ABSTRACT
OBJECTIVES: to analyze the spatiotemporal dynamics of the prevalence of congenital anomalies in in cities of Mato Grosso (MT), in the Mid-West of Brazil, from 2008 to 2019.
METHODS: an ecological study of cases in MT during the period from 2008 to 2019. The Annual Percent Change (APC) of the coefficients was used in the tendency analysis, through Prais-Winsten regression and the identification of high risk clusters.
RESULTS: the congenital malformation rate in the State was 6.52 per 1,000 live births, demonstrating a stationary tendency (APC-1.02; 95%CI= -2.93-0.93). Most congenital anomalies showed a stationary tendency, except for those of the cardiovascular system (APC=13.58; 95%CI= 3.60-24.52). Newborns with an Apgar score of ≤ 7 at the first and fifth minutes of life showed an increased tendency (APC=2.30; 95%CI=0.05-4.60 and APC=4.15; 95%CI= 1.52-6.65, respectively). The spatial distribution was heterogeneous, with the highest average rates of cases in the West, Central North, and South health macro-regions. The spatiotemporal scan identified three high risk clusters between 2015 and 2019, with a relative risk (RR) up to five times higher for anomalies.
CONCLUSION: congenital anomalies in MT exhibited a heterogeneous dynamic with specific high risk areas, and their increasing tendency among maternal and neonatal factors highlights the need for regional prevention and control strategies.
Keywords:
Congenital anomalies, Spatio temporal analysis, Spatio temporal clusters
RESUMO
OBJETIVOS: analisar a dinâmica espaço-temporal da prevalência de anomalias congênitas em municípios de Mato Grosso (MT), Centro-Oeste brasileiro, no período de 2008 a 2019.
MÉTODOS: estudo ecológico de casos residentes em MT, no período de 2008 a 2019. Utilizou-se a Variação Percentual Anual (VPA) dos coeficientes na análise de tendência, por meio de regressão de Prais-Winsten e identificação de clusters de alto risco.
RESULTADOS: a taxa de malformação congênita no estado foi de 6,52 por 1.000 nascidos vivos, apresentando tendência estacionária (VPA= -1,02; IC95%= -2,93-0,93). A maioria das anomalias congênitas apresentou tendência estacionária, exceto do aparelho cardiovascular (VPA=13,58; IC95%= 3,60-24,52). Neonatos com ≤7 pontos do índice de Apgar no primeiro e no quinto minutos de vida, apresentaram tendência crescente (VPA=2,30; IC95%= 0,05-4,60 e VPA=4,15; IC95%= 1,52-6,65, respectivamente). A distribuição espacial teve caráter heterogêneo com as maiores taxas médias de casos entre as macrorregiões de saúde Oeste, Centro-Norte e Sul, e a varredura espaço-temporal identificou três clusters de alto risco entre 2015 e 2019, com RR de até cinco vezes maior para anomalias.
CONCLUSÃO: as anomalias congênitas em MT apresentaram uma dinâmica heterogênea com áreas de alto risco específicas. A tendência crescente entre fatores maternos e neonatais destaca a necessidade de estratégias regionais de prevenção e controle.
Palavras-chave:
Anormalidades congênitas, Análise espaço-temporal, Conglomerados espaço-temporais
IntroductionCongenital anomalies (CA) are structural or functional abnormalities, including metabolic disorders, which can be identified before and during birth or later in life. They are disorders of prenatal origin, which can be caused by single gene defects, chromosomal disorders, multifactorial inheritance, environmental teratogens or micronutrient malnutrition. Among the CA are congenital malformations, which refer to defects in the morphogenesis of the organs or bodies.
1,2CA are commonly classified into major and minor anomalies. While major anomalies are mostly responsible for related deaths, morbidities and disabilities, although minor anomalies, more prevalent in the general population, do not cause significant health problems in the neonatal period and tend to have limited social or aesthetic consequences for the affected individual.
1 Internal CAs must also be considered, as well as external CAs, which will determine whether the diagnosis occurs in the prenatal period, during or after birth.
1It is estimated that 6% of live births (LB) are diagnosed with some type of congenital anomaly worldwide. However, according to the World Health Organization (WHO), this percentage may be higher because statistics generally do not take into account terminated pregnancies and stillbirths. Each year, around the world, 295,000 newborns die before reaching four weeks of age due to CA and associated complications.
3In Brazil, anomalies are the second leading cause of mortality under five years of age. Between 2010 and 2022, 37,126,352 LB were registered, of which 309,140 (0.83%) showed some kind of congenital anomaly, with an average of 24,000 LB per year presenting some CA, with a prevalence of 83 cases per 10,000 LB.
4 Among the federative units in Brazil, the regions with the highest prevalence of CA per thousand LB that stood out in 2022 were: Southeast, with 14.13; South, with 11.41; and Northeast, with 11.18.
4Between 2010 and 2019, Brazil reported 16,000 LB/year with some CA in the eight priority groups for birth surveillance in the country. These include: limb defects, congenital heart defects, oral clefts, neural tube defects, abdominal wall defects, microcephaly, genital defects and Down's Syndrome. These cases account for 66% per year of all live births diagnosed with any type of CA registered in the
Sistema de Informação sobre Nascidos Vivos (Sinasc)
4 (Live Birth Information System).
It is necessary to carry out continuous surveillance on births in order to determine the presence of CA. The prevalence of different health problems and conditions varies according to the characteristics of the person, time and place, taking into account maternal, gestational and LB characteristics. Evidence indicates that the most common CAs found are osteoarticular (30%), cardiovascular (25%) and head and neck (13%). These anomalies are associated with a greater chance of the event occurring in premature infants, in pregnant women aged over 40 and under 19, in newborns with birth weight between 500 and 2500g and over 3550g and in multiple pregnancies.
4,5A tendency and time analysis study (2001 to 2016) of CA carried out by Reis et al. (2021) indicated an increase in registrations over the years, growing from 19.3/10,000 in 2001 to 62.0/10,000 LB in 2016. Differences were observed between the cities investigated with CA clusters, with high values between the regions studied.
6 Thus, it is necessary to carry out studies that show robust spatio-temporal analyses, which allow the dynamics of CA to be visualized, as well as identifying the areas most at risk of its occurrence.
Therefore, the aim of this study was to analyze the spatio-temporal dynamics of the prevalence of congenital anomalies in the cities in Mato Grosso, in the Midwest of Brazil, from 2008 to 2019.
MethodsThis ecological study analyzes the temporal tendency, the average CA case rates and high-risk clusters in the 141 cities of the State of MT, Brazil, from 2008 to 2019.
The State of MT is located in the Midwest region of Brazil, has 141 cities included in the Amazônia Legal, Cuiabá as its capital, and is geographically divided into six health macro-regions: North, South, East, Central Northwest, West and Central North. It covers a territorial area of 903,208.361 km
2 and has a population of 3,658,813 inhabitants, with 58,169 LB in 2022.
7The data collection period was defined to cover events over twelve years. The data was extracted from SINASC, made available by the
Vigilância Epidemiológica da Secretaria Estadual de Saúde de Mato Grosso (SES/MT) (Epidemiological Surveillance of the Mato Grosso State Health Department). The collection included information on the characteristics of births and the registration of the presence of congenital anomalies on the
Declaração de Nascido Vivo (DNV) (Certificate of Live Birth). Only births in which a congenital anomaly was identified in the newborn were included in the study. Blank or ignored registration of congenital anomalies were not included in the analysis.
The study population (n=4,207) was made up of LB with CA, from mothers living in the cities in the State of Mato Grosso, between January 2008 and December 2019, as registered in SINASC from the DNV.
8The variables analyzed for maternal characteristics were: maternal age group (≤25 years and >25 years), maternal schooling (≤7 years and >7 years) and gestational age (≤36 weeks and >36 weeks).
The variables relating to the newborn were: sex (female and male), birth weight (≤2,500g and >2,500g) and Apgar score in the first and fifth minutes of life (≤7 and >7). The variables relating to CA were selected according to the International Code of Diseases (ICD10): chromosomal - Q90-Q99, central nervous system - Q00-Q07, head and neck - Q10-Q18, Q30-Q31; Q35-Q38, respiratory system - Q32-Q34, cardiovascular system - Q20-Q28, digestive system - Q39-Q45, genitals - Q50-Q56, urinary system - Q60-Q64 and musculoskeletal system - Q65-Q79.
The Annual Percentage Change (APC) of the coefficients was calculated using the Prais-Winsten regression, which corrects for first-order autocorrelation.
9 The dependent variable was the logarithm of the coefficients, and the independent variable was the years of the historical series. The quantitative estimation of the tendency was calculated using the following expression: APV= [- 1 + 10
b] *100%. The Confidence Intervals (CI) were calculated as: 95%CI= [- 1 + 10
b±t*se.] *100%, where "b" corresponds to the annual growth rate, "se" to the standard error and "t" to the value provided by the Student's t distribution table. The series was considered to be increasing when the rate was positive, decreasing when it was negative and stationary when there was no significant difference between its value and zero in the CI.
Spatial distribution was carried out with the average rates per city, considering the average number of cases and population of LB for the same period, multiplied by the constant 1,000. For the space-time scan, a circular window was defined to identify high-risk clusters (RR>1.0), using the discrete Poisson probability distribution, adaptive radius and plane coordinates (X,Y) for the cities in the State as an input parameters, with statistical significance using Monte Carlo simulation. SaTScan software, version 10.1.10, was used for the analysis
To estimate the Relative Risk (RR) and respective
p≤0.05 for each cluster, a value was calculated which represents the susceptibility of an area to the occurrence of the event in relation to the other areas studied.
10 The RR of the cities was also calculated to understand better the dynamics of each cluster identified. All the maps were generated using ArcGis 9x software (ESRI Corp).
This project was evaluated and approved by the Research Ethics Committee (CEP) of the
Universidade Federal de Mato Grosso – Área da Saúde Federal (University of Mato Grosso - Health Area), under the document of Opinion No. 4.082.907.
ResultsThe study included 4,207 cases of congenital anomalies during the study period, corresponding to a rate of 6.52 per 1,000 LB, showing a stationary tendency (APV -1.02; 95%CI= -2.93-0.93).
The prevalence of CA was higher among boys compared to girls, with rates of 7.14 and 5.68 per 1,000 LB, respectively, both showing a stationary tendency (Figure 1).
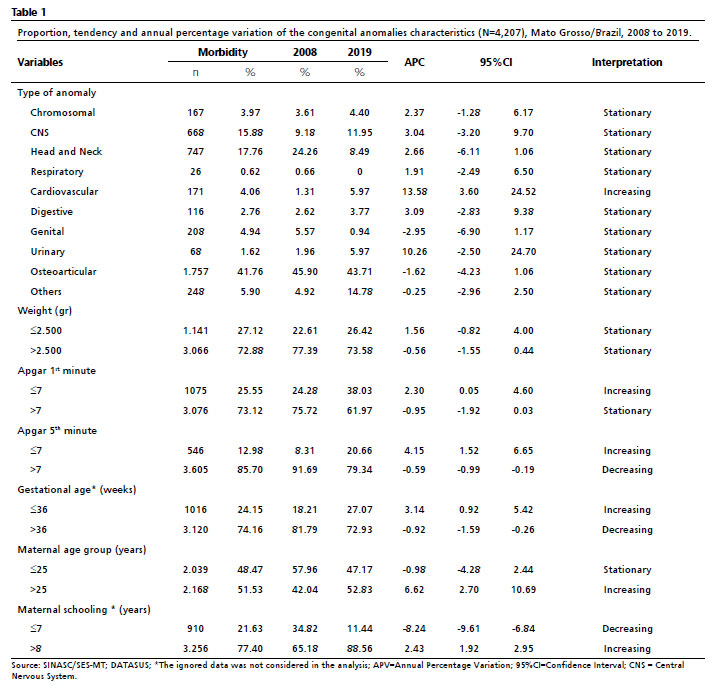
Regarding the presentation of CA characteristics (Table 1), it can be seen that all types of CA had a stationary tendency, with the exception of cardiovascular anomalies (APV=13.58; 95%CI= 3.60-24.52).
Still in terms of CA types, the highest proportion of cases was represented by osteoarticular anomalies (n=1757; 41.76%), followed by head and neck anomalies (n=747; 17.76%) and Central Nervous System (CNS) anomalies (n=668; 15.88%). Comparing 2008 with 2019, in isolation there was an increase in the proportion of CA for the CNS (9.9% versus 11.9%), the cardiovascular system (1.31%
versus 5.97%) and the urinary system (1.96% versus 5.97%). On the other hand, there was a reduction in the proportion of anomalies compared to those years for head and neck CA cases (24.2% versus 8.49%) and genital tract cases (5.57% versus 0.94%).
As for birth weight, anomalies were more frequent among those weighing more than 2,500g (n=3,066; 72.88%), with a stationary tendency (APV= -0.56; 95%CI= -1.55-0.44). LBs who scored ≤7 points in the first and fifth minutes of life on the Apgar score showed an upward tendency for CA (APV=2.30; 95%CI=0.05-4.60 and APV=4.15; 95%CI=1.52-6.65, respectively). The maternal analysis categories with an upward tendency include: age group over 25, schooling over seven years and gestational age of less than 36 weeks (APV=6.62; 95%CI=2.70-10.69; APV=2.43; 95%CI=1.92-2.95; APV=3.14; 95%CI=0.92-5.42, respectively).
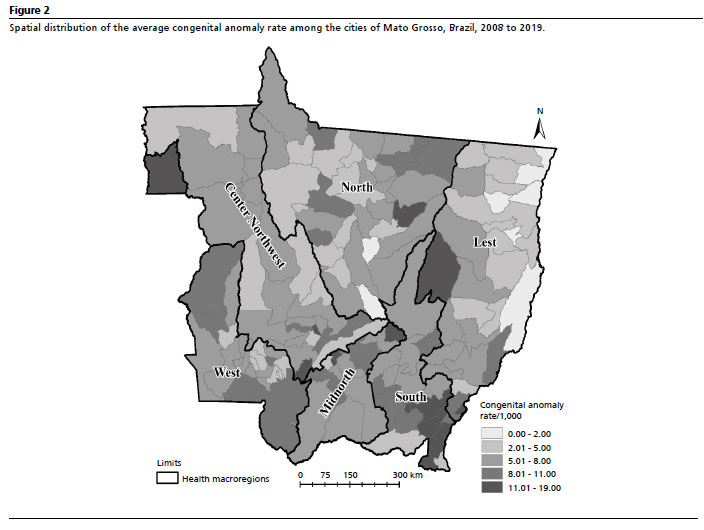
The spatial distribution of the average rates of congenital anomalies among the cities of Mato Grosso is heterogeneous, with rates above 11 cases per 1,000 LB being observed in all the health macro-regions, being more prevalent in the West, Central North and South health macro-regions (Figure 2).
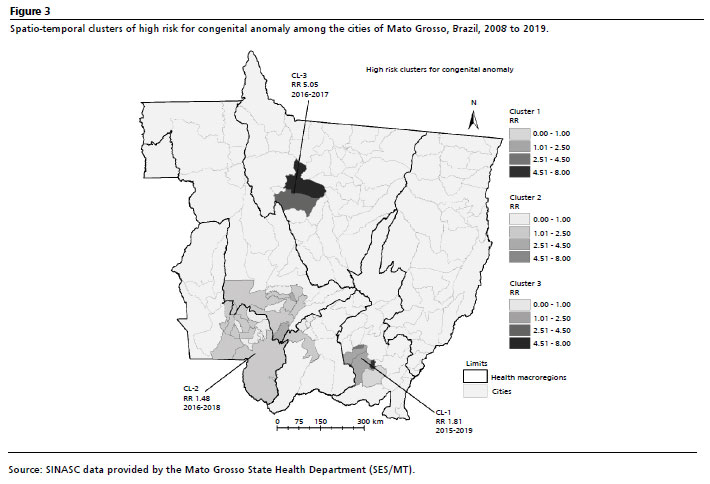
The spatio-temporal scan identified three high-risk clusters (Figure 3), statistically significant for the occurrence of CA, which included 35 cities (24.8%). Cluster 3 has a five-fold RR for the occurrence of CA in relation to the other cities in 2016 and 2017, and includes two cities (Porto dos Gaúchos and Tabaporã) belonging to the North health macro-region. Next was cluster 1, with a RR of 1.8 times for the occurrence of CA between 2015 and 2019, and included five cites belonging to the South health macro-region. Lastly, cluster 2, with a RR of 1.48, between 2016 and 2018, which included 28 citis belonging to the West, Central Northwest and Central North health macro-regions in the State.
DiscussionThe results of this study revealed heterogeneity in the prevalence of CA among the cities of MT during the period studied. Most CA showed a stationary tendency, except for those of the cardiovascular system, which increased significantly. There was a higher prevalence of osteoarticular anomalies, as well as among neonates weighing more than 2,500g, both of which showed a stationary tendency. Neonates who scored ≤7 points on the Apgar score in the first and fifth minutes of life showed an upward tendency in CA. Maternal characteristics associated with the occurrence of CA and with an increased tendency towards the condition included age over 25, higher schooling and gestational age of less than 36 weeks. The spatio-temporal analysis identified three high-risk clusters for CA, highlighting areas with greater susceptibility. These findings provide a detailed understanding of the variations and areas of higher risk, answering the objective of the study.
CAs are an important cause of childhood disability and mortality, especially in the neonatal period, and constitute a considerable and growing clinical and public health challenge due to their impact on the health of the population.
11A prevalence of CA of 6.52 per 1,000 LB was found, with a stationary tendency in MT during the period analyzed. This was lower than in other Brazilian States, according to other studies, which found an average CA occurrence rate of 9.20 per 1,000 LB from 2005 to 2014 in Rio Grande do Sul
12 and an average rate of 8.36 per 1,000 LB from 2015 to 2019 in Rondônia, another State in the Amazônia Legal.
13 However, the CA rate in the State of MT is similar to that found in a study carried out between 2001 and 2016 in the State of Maranhão, with a prevalence of 6.2 per 1,000 LB.
14The fluctuation in the overall prevalence rate between 2008 and 2015 shown in Figure 1 may have been attributed to a change applied to the DNV from 2011 onwards, which may have led to an increase in the number of notifications.
11 The data from this study showed that osteoarticular anomalies were the most frequent, similar to studies in Rio Grande do Sul and Rondônia.
12,13 This may be due to the ease with which these CAs can be identified by imaging studies during prenatal care or physical examination after childbirth.
15A small, statistically non-significant increase in CAs of the CNS was also identified, from 9.9% in 2008 to 11.9% in 2019, possibly explained by exposure to the Zika virus from 2015 onwards, according to an analysis by the Ministry of Health.
16 There was a tendency towards an increase in the proportion of CAs of the cardiovascular system, reinforcing surveillance in specific cases, such as the institution of pulse oximetry as a neonatal screening test.
17Similar to other studies,
13,18,19 the State of MT showed a higher prevalence of CA in newborns weighing over 2,500g. Congenital defects may be associated with these newborn characteristics.
20,21It was observed that CAs had increasing tendencies for Apgar scores lower than seven in the first and fifth minutes of birth, and in neonates born at less than 37 weeks of gestation, reinforcing prematurity as a risk factor. Prematurity, together with the occurrence of CA, represents an important public health problem, increasing neonatal morbidity and mortality.19
This study also indicated an increasing tendency of CA among the maternal population aged over 25, confirming the results of a study which indicated that the average maternal age with CA was 25.59±7.6 years, with only 10% of mothers were aged over 40.
21 Chromosomal meiotic errors increase with maternal age, which can result in CA.
22This study found a higher prevalence and increasing tendency of CA in mothers with more than seven years of schooling, indicating that better maternal schooling can help in the early diagnosis of CA,
11 diverging from other studies
11,13,23,24 which associated CA with mothers with less than seven years of schooling. Further research is needed to explore this association.
Spatial distribution revealed heterogeneous variations in average CA rates in all the cities, with a higher prevalence in the West, Central North and South health macro-regions. The spatio-temporal scan statistic identified areas of greater risk in the period from 2015 to 2019, which included 24.8% of the cities with cluster 3 (2016 and 2017) standing out, located in the North macro-region, which showed a five-fold higher RR for the occurrence of CA. Cities in this North macro-region are among the largest producers of grains and sugar cane, as well as a 49.41% increase in the area planted with soybeans between 2003 and 2015,
25 with the use of large quantities of pesticides, which may be related to the greater risk of CA.
In MT, the sale of pesticides from 2000 to 2016 was increased by 480.3%, which exceeded the increase in the area planted (139.6%). Exposure to pesticides is associated with CA, which may corroborate the hypothesis that environmental exposure has increased the prevalence of CA, especially in rural newborns.
26,27,28The main limitations of this study are related to the quality and completeness of the data obtained from the DNV and SINASC, which can vary among cities and over time. Reliance on secondary data can lead to underreporting or inaccurate classifications of CA, impacting on the accuracy of prevalence estimates. In addition, the change in the DNV from 2011 onwards may have influenced fluctuations in prevalence rates, making direct comparisons over the period studied difficult. Heterogeneity in the availability and quality of health services among cities can also affect the detection and registration of CA, potentially underestimating prevalence in areas with less access to adequate health care. Spatial and temporal analysis, although robust, may not capture all the nuances of the environmental and socioeconomic variables that contribute to the occurrence of CA. In addition, the causal relationship between exposure to pesticides and increased CA, suggested by the high-risk clusters identified, could not be confirmed in this study and requires further investigation.
This study contributes to understanding the prevalence and spatial distribution of CA in MT, identifying high-risk clusters and the tendency of CA according to maternal and newborn characteristics. It is recommended to implement active surveillance programs for CA, covering live births, stillbirths and abortions, to improve early detection and monitoring. It is essential to further investigate the relation between exposure to pesticides and the occurrence of CA, especially in agricultural areas.
References1. World Health Organization (WHO). Birth defects surveillance: a manual for programme managers, second edition. Geneva: WHO; 2020. [access in 2024 Jul 24]. Available from:
https://www.who.int/publications/i/item/97892400153952. Mekonen, H.K., Berhe, Y., Berihu, B.A. Teka H, Hadgu A, Gebregziabher L,
et al. A silent epidemic of major congenital malformations in Tigray, northern Ethiopia: hospital-based study. Sci Rep. 2021; 11 (1): 21035.
3. World Health Organization (WHO). Congenital disorders. Geneva: WHO; 2023. [
Internet]. access in 2024 Jul 24]. Available from:
https://www.who.int/news-room/fact-sheets/detail/birth-defects4. Ministério da Saúde (BR). Secretaria de Vigilância em Saúde e Ambiente. Boletim Epidemiológico Vol. 54 Nº 3. Análise da situação epidemiológica das anomalias congênitas no Brasil, 2010 a 2021. Brasília (DF): Ministério da Saúde; 2023. [
Internet]. [access in 2024 Jul 24]. Available from:
https://www.gov.br/saude/pt-br/centrais-de-conteudo/publicacoes/boletins/epidemiologicos/edicoes/2023/boletim-epidemiologico-volume-54-no-03/view 54: 1-26.5. Cosme HW, Lima LS, Barbosa LG. Prevalence of congenital anomalies and their associated factors in newborns in the City of São Paulo from 2010 to 2014. Rev Paul Pediatr. 2014 Mar; 35 (1): 33-8.
6. Reis LC, Barbian MH, Cardoso-dos-Santos AC, Silva EVL, Boquett JA, Schuler-Faccini L. Prevalence of congenital anomalies at birth among live births in the state of Maranhão from 2001 to 2016: temporal and spatial analysis. Rev Bras Epidemiol. 2021; 24 (Suppl. 1): 1-11.
7. Instituto Brasileiro de Geografia e Estatística (IBGE). Nascidos Vivos [
Internet]. Brasil, 2022. [access in 2024 Jul 24]. Available from:
http://tabnet.datasus.gov.br/cgi/tabcgi.exe?sinasc/cnv/nvuf.def 8. Castilla EE, Oriolli IM, Luquetti DV, Dutra MG. Manual de preenchimento e de codificação de anomalias congênitas no campo 34 da DN (SINASC). ECLAMC: Estudo Colaborativo Latino Americano de Malformações Congênitas. INaGeMP no IOC; 2010.
9. Antunes JLF, Cardoso MRA. Uso da análise de séries temporais em estudos epidemiológicos. Epidemiol Serv Saúde. 2015 Set; 24 (3): 565-76.
10. Kulldorff M. SaTScanTM user guide for version 10.1. 2018. [access in 2023 Oct 20]. Available from:
https://www.satscan.org/cgibin/satscan/register.pl/SaTScan_Users_Guide.pdf?todo=process_userguide_download.11. Luz GDS, Karam SM, Dumith SC. Anomalias congênitas no estado do Rio Grande do Sul: análise de série temporal. Rev Bras Epidemiol. 2019; 22: 1-14.
12. Ministério da Saúde (BR). Secretaria de Vigilância em Saúde. Boletim Epidemiológico Vol. 52 Nº6. Anomalias congênitas no Brasil, 2010 a 2019: análise de um grupo prioritário para a vigilância ao nascimento. Brasília (DF): Ministério da Saúde; 2021. [access in 2024 Jul 23]. Available from:
http://plataforma.saude.gov.br/anomalias-congenitas/boletim-epidemiologico-SVS-06-2021.pdf14. Reis LC, Barbian MH, Cardoso-dos-Santos AC, Silva EVL, Boquett JA, Schuler-Faccini L. Prevalence of congenital anomalies at birth among live births in the state of Maranhão from 2001 to 2016: temporal and spatial analysis. Rev Bras Epidemiol. 2021; 24 (Suppl. 1): e210020.
15. Wojcik MH, Agrawal PB. Deciphering congenital anomalies for the next generation. Cold Spring Harb Mol Case Stud. 2020 Oct; 6 (5): a005504.
16. Brasil. Ministério da Saúde. Saúde Brasil 2015/2016: uma análise da situação de saúde e da epidemia pelo vírus Zika e por outras doenças transmitidas pelo Aedes aegypti. Brasília (DF): Ministério da Saúde, 2017. [access in 2024 Jul 23]. Available from:
https://bvsms.saude.gov.br/bvs/publicacoes/saude_brasil_2015_2016_analise_zika.pdf17. Brasil. Portaria nº 20, de 10 de Junho de 2014. Torna pública a decisão de incorporar a oximetria de pulso - teste do coraçãozinho, a ser realizado de forma universal, fazendo parte da triagem Neonatal no Sistema Único de Saúde - SUS. Brasília (DF): DOU de 10 de Junho de 2014. [access in 2024 Jul 23]. Available from:
https://bvsms.saude.gov.br/bvs/saudelegis/sctie/2014/prt0020_10_06_2014.html18. Freitas LCS, Nunes AA, Meneguci J, Nascimento Neto GC, Castro SS. Association of congenital anomalies in live births with their obstetric-neonatal and sociodemographic profiles. Texto Contexto Enferm. 2021; 30: e20200256.
19. Gonçalves MKS, Cardoso MD, Lima RAF, Oliveira CM, Bonfim CV. Prevalência e fatores associados às malformações congênitas em nascidos vivos. Acta Paul Enferm. 2021; 34: eAPE00852.
20. Franciotti D, Mayer G, Cancelier AC. Fatores de risco para baixo peso ao nascer: um estudo de caso-controle. Arq Cat Med. 2010; 39: 63-9.
21. Qadir M, Amir Shahril, Bano S. Prevalence and associated risk factors of congenital anomalies at a tertiary care hospital. Pak J Med Sci. 2017; 11: 942-4.
22. Toufaily MH, Westgate MN, Lin AE, Holmes LB. Causes of Congenital Malformations. Birth Defects Res. 2018; 110: 87-91.
23. Vanassi BM, Parma GC, Magalhães VS, Santos ACC, Isera BPM. Anomalias congênitas em Santa Catarina: distribuição e tendências no período de 2010–2018. Rev Paul Pediatr
. 2021; 40: e2020331.
24. Tran M, Miner A, Merkel C, Sakurai K, Woon J, Ayala J,
et al. Sociodemographic profile associated with congenital heart disease among infants <1 year old. J Pediatr Nurs. 2023; 73: e618-23.
25. Santos NB, Faria AMM, Dallemole D, Manso JRP. Desenvolvimento e crescimento econômico das macrorregiões de Mato Grosso nos anos 2005 e 2013. Interações (Campo Grande). 2017; 18 (3): 169–82.
26. Dutra LS, Ferreira AP. Tendência de malformações congênitas e utilização de agrotóxicos em commodities: um estudo ecológico. Saúde Debate. 2019; 43: 390-405.
27. Dutra LS, Ferreira AP. Malformações congênitas em regiões de monocultivo no estado de Minas Gerais, Brasil. Medicina (Ribeirão Preto). 2017; 50: 285-96.
28. Nicoll R. Environmental contaminants and congenital heart defects: A re-evaluation of the evidence. Int J Environ Res Public Health. 2018; 15: 2096.
Acknowledgements: We would like to thank the
Programa de Apoio à Pós-Graduação (PROAP) (Undergraduate Support Program) for its financial support.
Authors' contributions: Groth BR: conception and planning of the study, data collection, analysis and interpretation. Fer-reira SMB: conception and planning of the study, drafting or revising the manuscript. Silva EG, Rocha CBA, Freitas BHBM, Santos ES, Battisti IDE: data collection, analysis and interpretation. Machado RBF, Ferreira EAB, Machado LMG: drafting or revising the manuscript. All the authors have approved the final version of the article and declare no conflict of interest.
Received on April 23, 2024
Final version presented on September 23, 2024
Approved on September 24, 2024
Associated Editor: Karla Bomfim


 ; Eliziani Gonçalves da Silva2
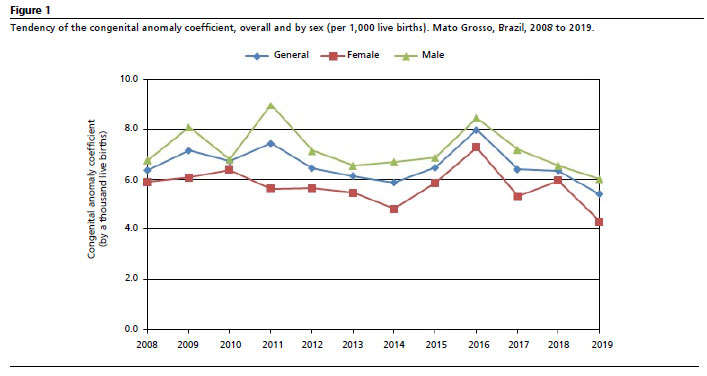


 Ler em português